调试一则:为什么 GNOME 在我的电脑上这么慢?
TOC | 目录
距离我切换到 Linux 作为自己的主力桌面环境已经过去了半年的时间。在这半年里,我一直在使用 GNOME Wayland 作为桌面环境,总体上来讲,体验还算不错,虽然有一些小问题和槽点(作为参考,这是我在去年九月 USTCLUG 的软件自由日上分享的闪电演讲 slides)。其中其他的问题都可以通过某些方式缓解,但是对我影响最大的问题是:GNOME 跑起来最开始很流畅,但是两三天之后就越来越卡,CPU 占用也很高。
而且,Wayland session 还带来了一点负加成:不能只重启混成器(在这里是 gnome-shell)而保留其他的用户进程。也就是说,靠 Alt + F2 然后输入 r 是做不到的。这导致我每隔两三天就要 logout 然后再 login,否则到最后鼠标晃一晃都卡,生产力大幅降低。因此前段时间我打算来尝试解决这个问题。
资料收集
找一些关键词,可以搜索到 gnome-shell 的这个 issue:GNOME Shell becomes extremely slow and consumes tons of CPU,其中 issue 作者介绍:
- 有时候在长时间放着电脑不动,然后再回来的时候,GNOME Shell 就会变得很卡,CPU 占用很高;
- 把扩展坞拔掉之后就又好了;
- perf 显示
g_source_iter_next占用了大量的 CPU 时间; -
gcore生成的 coredump 里面也显示主线程在g_source_iter_next。
尽管 issue 里面没有直接能起到帮助的内容,但是有很重要的几点:
- GDB 的 gcore 可以在运行时生成 coredump,里面说不定有很多有意义的信息(当然了,你得把调试符号装了,否则 coredump 基本没啥意义);
- perf 可以看 gnome-shell 的 CPU 热点。
Perf?
在下次卡顿的时候,参考上面的 issue,我尝试用 perf 跑了一下:
perf record -e cycles:u -g --call-graph=lbr
但是 perf report 的结果却匪夷所思:
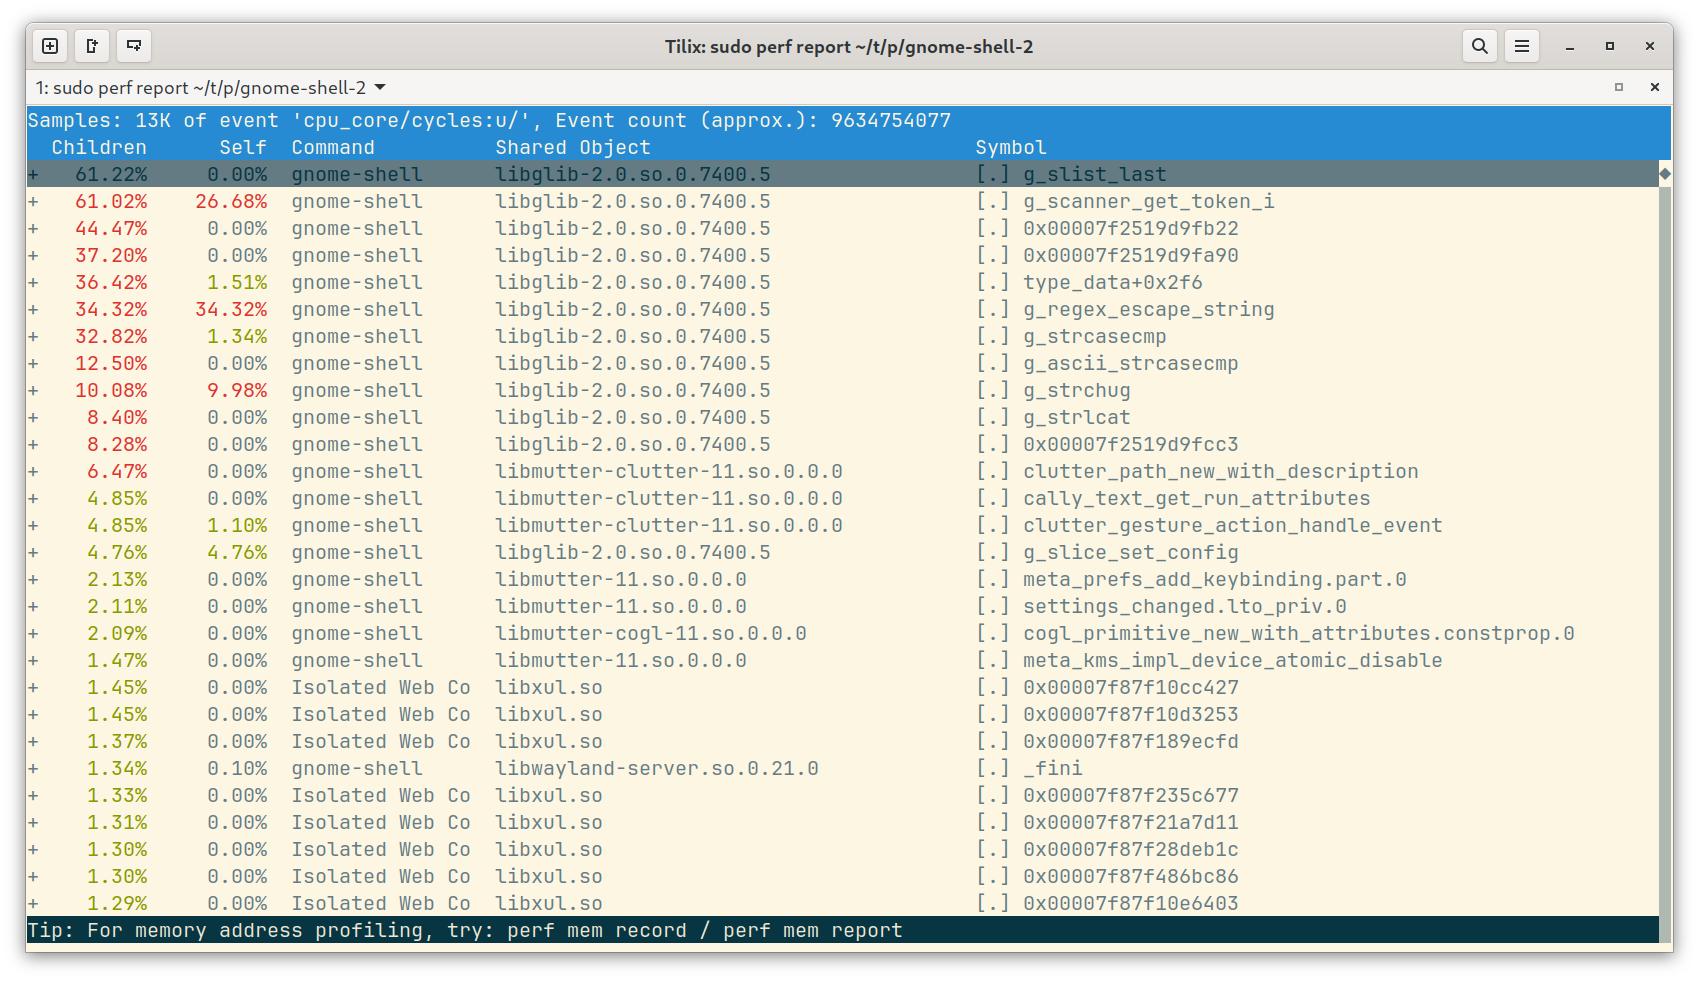
- 看起来大部分时间花在字符串处理上(
g_scanner_get_token_i,g_regex_escape_string,g_strchug为前三名自身调用 CPU 占比最高的)? -
g_slist_last的实现就是再简单不过的链表遍历,为什么它的 Children 值会这么高?
展开之后的调用链也怪怪的:
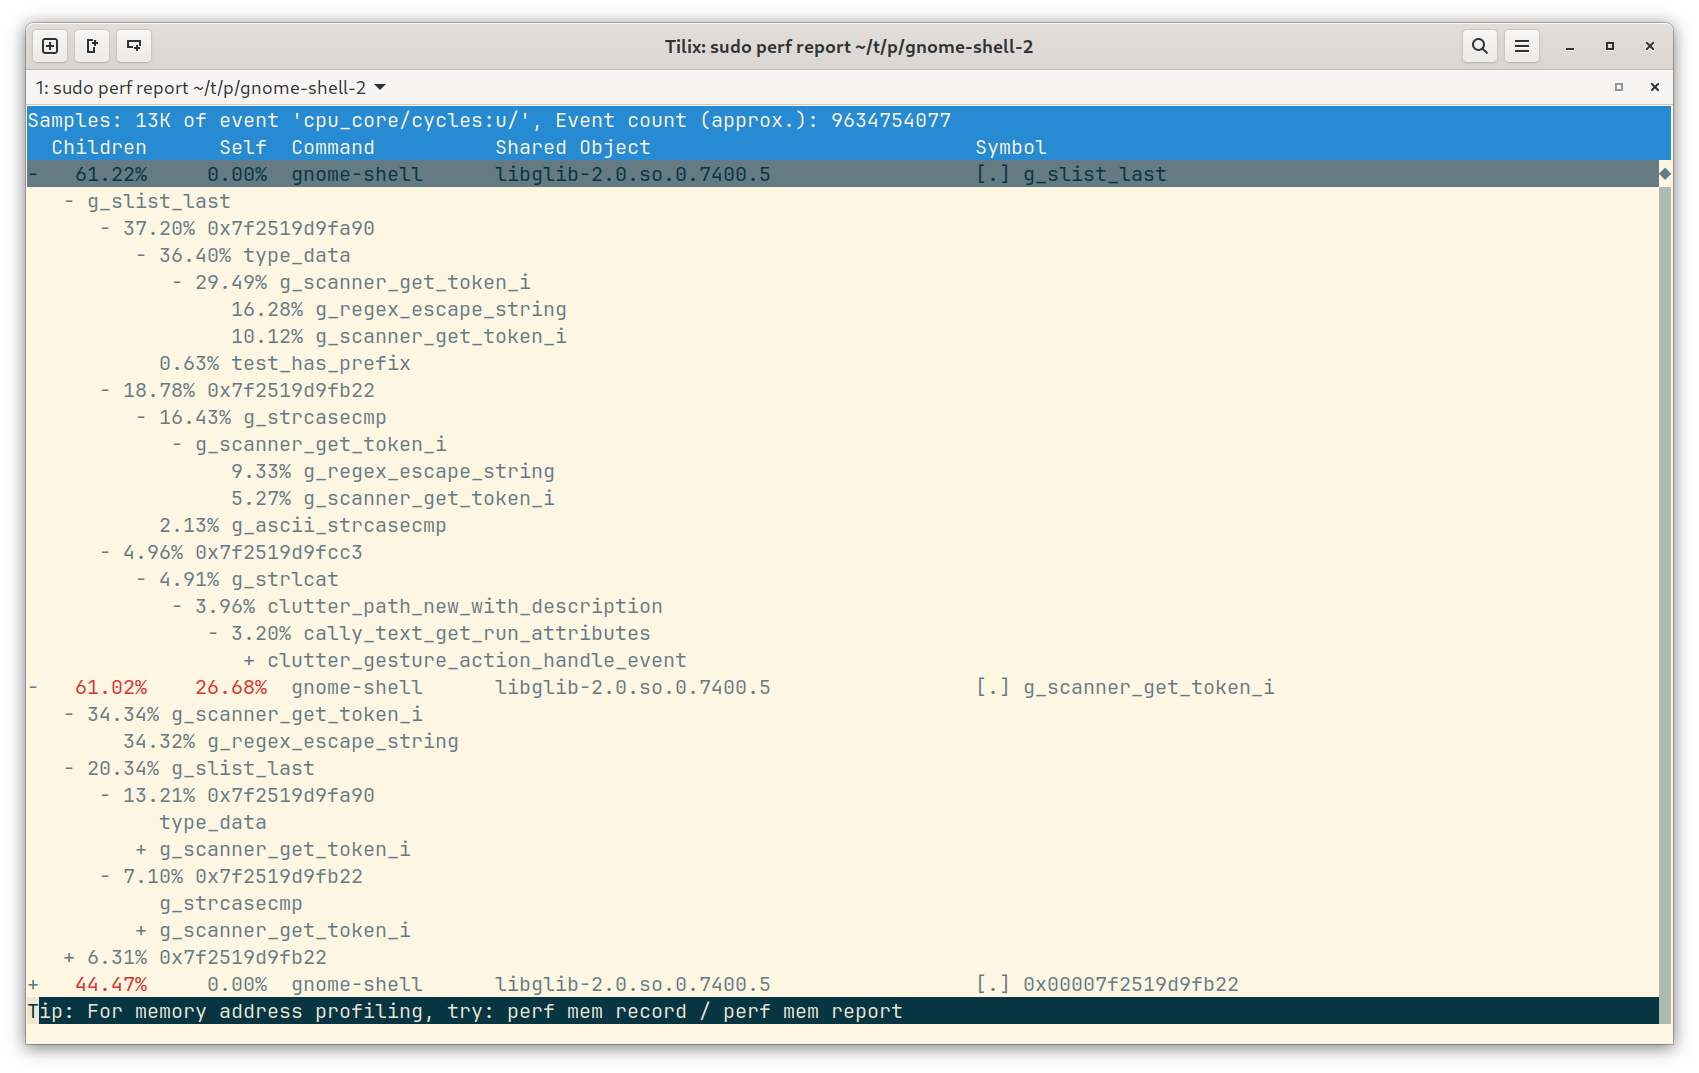
至少我是看不出来到底哪里出了问题,看了 glib 的代码,甚至最后解决了问题之后也还是想不通:为什么 regex escape 会占用这么大的 CPU 时间?
看看 coredump 吧
在 perf 没有思路的情况下,尝试做了几个 coredump(gcore $(pidof gnome-shell))看看情况。同时在 @libreliu 的推荐下,也用 eu-stack 看了看正在运行中的 gnome-shell 的 backtrace。
首先 sudo eu-stack --pid=$(pidof gnome-shell) -m 做了一些采样,发现活跃的其实只有主线程,其他的线程要么在 poll,要么在 futex wait,不太可能是它们导致的卡顿。
因此之后应该盯着主线程看就行。作为参考,这是其中某个 coredump 的主线程 backtrace:
#0  0x00007f2519d48574 in g_main_context_prepare (context=0x56505bdc2ab0, priority=0x7ffea40dd3f8) at ../glib/glib/gmain.c:3792
3792	          if (result == FALSE && source->priv->ready_time != -1)
[Current thread is 1 (Thread 0x7f25142deb00 (LWP 1936586))]
>>> bt full
#0  0x00007f2519d48574 in g_main_context_prepare (context=0x56505bdc2ab0, priority=0x7ffea40dd3f8) at ../glib/glib/gmain.c:3792
        result = <optimized out>
        prepare = 0x0
        source_timeout = -1
        i = <optimized out>
        n_ready = 0
        current_priority = 2147483647
        source = 0x56505f905730
        iter = {
          context = 0x56505bdc2ab0,
          may_modify = 1,
          current_list = 0x56505bdc2d60 = {[0] = 0x56505bdc2d40, [1] = 0x56505bdde360, [2] = 0x56506201e0a0, [3] = 0x56505e6bef20},
          source = 0x56505f905730
        }
#1  0x00007f2519d9fa96 in g_main_context_iterate.constprop.0 (context=0x56505bdc2ab0, block=1, dispatch=1, self=<optimized out>) at ../glib/glib/gmain.c:4228
        max_priority = 0
        timeout = 4
        some_ready = <optimized out>
        nfds = <optimized out>
        allocated_nfds = 39
        fds = <optimized out>
        begin_time_nsec = 1019133648184898
#2  0x00007f2519d47d8f in g_main_loop_run (loop=0x56505dd1ced0) at ../glib/glib/gmain.c:4448
        __func__ = "g_main_loop_run"
#3  0x00007f2518ed0d3b in meta_context_run_main_loop (context=0x5650647779b0, context@entry=0x56505bdbe0c0, error=0x56505bdc2ab0, error@entry=0x7ffea40dd4d0) at ../mutter/src/core/meta-context.c:455
        priv = 0x56505bdbe050
        __func__ = "meta_context_run_main_loop"
#4  0x000056505b3c448d in main (argc=<optimized out>, argv=<optimized out>) at ../gnome-shell/src/main.c:582
        context = 0x56505bdbe0c0
        error = 0x0
        ecode = 0
参考 https://gitlab.gnome.org/GNOME/gnome-shell/-/issues/62#note_117928 的评论,加载 glib_gdb 插件看一下 source_lists 的内容:
>>> source /usr/share/glib-2.0/gdb/glib_gdb.py
>>> gforeach i in context->source_lists: print (((GSourceList *)$i)->head)->name
$1 = 0x7f2519f78871 "GCancellable"
$2 = 0x0
$3 = 0x7f2519e0cb6a "GUnixSignalSource: SIGTERM"
$4 = 0x56505c38edf0 "[mutter] Wayland events"
$5 = 0x565063b1e040 "[mutter] Clutter frame clock (0x56506442a030)"
$6 = 0x0
好像没什么异常的嘛!看一下当前的事件:
>>> print *source
$7 = {
  callback_data = 0x565065296360,
  callback_funcs = 0x7f2519e303e0 <g_source_callback_funcs>,
  source_funcs = 0x7f251908f120 <idle_monitor_source_funcs>,
  ref_count = 2,
  context = 0x56505bdc2ab0,
  priority = 0,
  flags = 1,
  source_id = 3971079,
  poll_fds = 0x0,
  prev = 0x5650647779b0,
  next = 0x565064689800,
  name = 0x5650652fceb0 "[mutter] Idle monitor",
  priv = 0x7f23fb15dc90
}
emmm 为什么这个 source 不在上面显示的 source_lists 里面呢?这个问题我当时没有想清楚,但是之后我看了一下 context:
>>> print *context
$8 = {
  mutex = {
    p = 0x1,
    i = {[0] = 1, [1] = 0}
  },
  cond = {
    p = 0x0,
    i = {[0] = 0, [1] = 0}
  },
  owner = 0x56505be55f60,
  owner_count = 2,
  flags = G_MAIN_CONTEXT_FLAGS_NONE,
  waiters = 0x0,
  ref_count = 15634,
  sources = 0x56505bda6b00 = {
    [0x69fb08] = 0x5650680e3330,
    [0x3a3d45] = 0x5650641cebb0,
    [0x923354] = 0x565064cceaa0,
    [0x427140] = 0x565066146120,
    [0xad54f7] = 0x56506807eeb0,
    [0x9fe13c] = 0x5650681e2680,
    [0x61c13d] = 0x565063ae0320,
    [0x3dc2ed] = 0x565062e24b50,
    [0xac60a6] = 0x565067888d70,
    [0x3d42f3] = 0x565062457650,
    [0xaeac2e] = 0x56506a500a40,
    [0x14e7c1] = 0x5650627ae2c0,
    [0x1484dd] = 0x565064ef0910,
    [0x415fda] = 0x565066611ab0,
    [0x1] = 0x56505bdcf050,
    [0x69fb0a] = 0x565064bd82d0,
    [0x923356] = 0x565060f89ea0,
    [0x10e7f1] = 0x56505e2f4960,
    [0x427142] = 0x565060172940,
    [0x4288a] = 0x565063f351d0,
    [0x9121ef] = 0x565065623200,
    [0x3dc2ef] = 0x5650660eef50,
    [0x485f87] = 0x5650644c5ea0,
    [0xad54f9] = 0x565066d38aa0,
    [0x61c13f] = 0x5650648bd220,
    [0x3237d7] = 0x565063fac8c0,
    [0x3d42f5] = 0x565063ff6790,
    [0x9c4a24] = 0x565064412200,
    [0xaeac30] = 0x5650639f3400,
    [0x78a316] = 0x56505c1b56d0,
    [0x14e7c3] = 0x565064753c80,
    [0xa37e2b] = 0x565060125f90,
    [0x4] = 0x56505bdc8f00,
    [0xd9c78] = 0x565063d5e2a0,
    [0xad54fb] = 0x565064b01620,
    [0x4288c] = 0x56505f38eb10,
    [0x9121f1] = 0x56506811c920,
    [0x3dc2f1] = 0x565061086ce0,
    [0x5] = 0x56505bee6ea0,
    [0x7dfa1d] = 0x565065399f90,
    [0x3237d9] = 0x565060a68d90,
    [0x2666f3] = 0x5650625c4800,
    [0x9121f3] = 0x56506885fdf0,
    [0xaa9af0] = 0x56505c34c740,
    [0x3237db] = 0x56505cd96930,
    [0x2f322e] = 0x5650610659c0,
    [0x9c4a28] = 0x565066b3c790,
    [0x2666f5] = 0x565062b286a0,
    [0x8be805] = 0x56506515d870,
    [0x10e7f8] = 0x565064367cc0,
    [0xa37e30] = 0x565065c43520,
    [0x495f81] = 0x565060416f90,
    [0x7dfa21] = 0x565065bf9f30,
    [0x2f3230] = 0x565060c80f20,
    [0x850b41] = 0x56505d242a60,
    [0x2666f7] = 0x56505c75acb0,
    [0x36fd76] = 0x56505f567b90,
    [0x35f7b1] = 0x565064ac1420,
    [0x10e7fa] = 0x56505f21b710,
    [0x861caa] = 0x5650601b5270,
    [0x925646] = 0x565069aa5370,
    [0x2f3232] = 0x565066e09dd0,
    [0x2d4f60] = 0x56505f4e2590,
    [0x8be808] = 0x565069b14a00,
    [0x8d850c] = 0x565065541980,
    [0x378914] = 0x565060738d60,
    [0x2dc3b8] = 0x56505f432c60,
    [0xc] = 0x56505c0c7b90,
    [0x41fcf4] = 0x56505d1be040,
    [0x35f7b3] = 0x565063109a60,
    [0x59f032] = 0x565066b7be80,
    [0x310f34] = 0x565066e93fe0,
    [0x3dabb4] = 0x565065becc70,
    [0x2d4f62] = 0x565066df25b0,
    [0x8be80a] = 0x5650683ac340,
    [0x378916] = 0x5650629356c0,
    [0x71c08a] = 0x565063c7cc80,
    [0x925649] = 0x565069a95d20,
    [0x35f7b5] = 0x565066c57da0,
    [0x7e6e7e] = 0x565069346380,
    [0x3dabb6] = 0x565062699710,
    [0x8d850f] = 0x56506a75e950,
    [0x6863e4] = 0x565065e8cf90,
    [0x2eec67] = 0x5650658989e0,
    [0x9ef89b] = 0x565068025030,
    [0x2d4f64] = 0x5650642ce5f0,
    [0x8be80c] = 0x565064220980,
    [0x378918] = 0x5650648728b0,
    [0x90a202] = 0x565064b2f860,
    [0x71c08c] = 0x565066ab6270,
    [0x861caf] = 0x565062fd22b0,
    [0x10e7ff] = 0x56505c205ca0,
    [0x92564b] = 0x5650601cda30,
    [0x7a0bcc] = 0x565066eb4a70,
    [0x2eec69] = 0x5650652a04b0,
    [0x8d8511] = 0x565060dffcb0,
    [0x6863e6] = 0x565066855b50,
    [0x8de7f5] = 0x56506390d060,
    [0x658cc2] = 0x56506539c940,
    [0x3dabb8] = 0x565066e21b90
    ...
  },
  pending_dispatches = 0x56505bdc2c00,
  timeout = 29978,
  next_id = 11915638,
  source_lists = 0x7f24b4001900 = {[0] = 0x7f24a4001800, [1] = 0x7f24a40f2d20, [2] = 0x56505bdc2d40, [3] = 0x56505bdde360, [4] = 0x56506201e0a0, [5] = 0x56505e6bef20},
  in_check_or_prepare = 0,
  poll_records = 0x56505bdc2c20,
  n_poll_records = 35,
  cached_poll_array = 0x56505fbde300,
  cached_poll_array_size = 39,
  wakeup = 0x56505bdae370,
  wake_up_rec = {
    fd = 3,
    events = 1,
    revents = 0
  },
  poll_changed = 0,
  poll_func = 0x7f2519d4f0f0 <g_poll>,
  time = 1019133648187,
  time_is_fresh = 1
}
诶等等,sources 里面怎么这么多东西?而且看起来还没有 print 完,随便采样几个:
>>> print *(GSource *)0x56506885fdf0
$9 = {
  callback_data = 0x7f23b7637d20,
  callback_funcs = 0x7f2519e303e0 <g_source_callback_funcs>,
  source_funcs = 0x7f251908f120 <idle_monitor_source_funcs>,
  ref_count = 1,
  context = 0x56505bdc2ab0,
  priority = 0,
  flags = 1,
  source_id = 9511411,
  poll_fds = 0x0,
  prev = 0x56506811c920,
  next = 0x565069a87760,
  name = 0x565068eaede0 "[mutter] Idle monitor",
  priv = 0x7f23a8477730
}
>>> print *(GSource *)0x565060dffcb0
$10 = {
  callback_data = 0x7f23b72b71b0,
  callback_funcs = 0x7f2519e303e0 <g_source_callback_funcs>,
  source_funcs = 0x7f251908f120 <idle_monitor_source_funcs>,
  ref_count = 1,
  context = 0x56505bdc2ab0,
  priority = 0,
  flags = 1,
  source_id = 9274641,
  poll_fds = 0x0,
  prev = 0x56506a75e950,
  next = 0x5650688a62b0,
  name = 0x565060b99bc0 "[mutter] Idle monitor",
  priv = 0x7f23b77db350
}
>>> print *(GSource *)0x565060a68d90
$11 = {
  callback_data = 0x7f23fa0aeaa0,
  callback_funcs = 0x7f2519e303e0 <g_source_callback_funcs>,
  source_funcs = 0x7f251908f120 <idle_monitor_source_funcs>,
  ref_count = 1,
  context = 0x56505bdc2ab0,
  priority = 0,
  flags = 1,
  source_id = 3291097,
  poll_fds = 0x0,
  prev = 0x565063fac8c0,
  next = 0x56505cd96930,
  name = 0x565066c08d20 "[mutter] Idle monitor",
  priv = 0x565060443230
}
怎么全是 [mutter] Idle monitor?这里肯定有点问题。
GDB with pwntools?
从 sources 那里的省略号可以看出,其实里面还有别的东西,这可以用下面的命令看到:
print -elements unlimited -- context->sources
但是要怎么方便地看出 sources 里面的内容?glib gdb 插件提供的 gforeach 似乎不支持这样的功能,而且 gdb 也不支持一次执行多条调试语句。于是我想出了一个歪主意:写个脚本和 GDB 交互。我用 pwntools 略熟悉一些,所以脚本就用它写了(可以看成是高配版的 expect(1),大概吧?)。
from pwn import *
import argparse

parser = argparse.ArgumentParser()
parser.add_argument('file', help='file to run')
args = parser.parse_args()

# context.log_level = "debug"
p = process(f'gdb -c {args.file}', shell=True)
# 我的 GDB 加载了 https://github.com/cyrus-and/gdb-dashboard
# 所以 prompt 和标准的有所不同
p.recvuntil(">>>")
p.sendline("set style enabled off")
p.recvuntil(">>>")
p.sendline("up")
p.recvuntil(">>>")
# p.sendline("up")
# p.recvuntil(">>>")
p.sendline("print -elements unlimited -- context->sources")
data = p.recvuntil(">>>").decode("utf-8")

address = []

state = 0
number = ""
for i in range(len(data)):
    current_char = data[i]
    if current_char == "=":
        state = 1
    if current_char == "," or current_char == "[":
        state = 0
        if number:
            address.append(number)
            number = ""
    if state == 1:
        if current_char.isdigit() or current_char.isalpha():
            number += current_char

# print(address)

for i in address:
    p.sendline(f"print *(GSource *){i}")
    print(p.recvuntil(">>>").decode("utf-8"))

p.interactive()
果不其然:
> grep "Idle monitor" 1936586-sources-1.txt | wc
   7224   43344  353976
> grep "ref_count" 1936586-sources-1.txt | wc
   7313   21939  124321
总共才 7313 个 source,idle monitor 占了将近 99%。就算和我遇到的性能问题无关,这里肯定也是有点问题的。
Idle monitor?
很容易就能在 mutter 代码(作为 GNOME Wayland 混成器的核心组件,mutter 是嵌入在 gnome-shell 里面的库)里面找到产生这个 source 的函数:
static MetaIdleMonitorWatch *
make_watch (MetaIdleMonitor           *monitor,
            guint64                    timeout_msec,
            MetaIdleMonitorWatchFunc   callback,
            gpointer                   user_data,
            GDestroyNotify             notify)
{
  MetaIdleMonitorWatch *watch;

  watch = g_new0 (MetaIdleMonitorWatch, 1);

  watch->monitor = monitor;
  watch->id = get_next_watch_serial ();
  watch->callback = callback;
  watch->user_data = user_data;
  watch->notify = notify;
  watch->timeout_msec = timeout_msec;

  if (timeout_msec != 0)
    {
      GSource *source = g_source_new (&idle_monitor_source_funcs,
                                      sizeof (GSource));
      g_source_set_name (source, "[mutter] Idle monitor");

      g_source_set_callback (source, NULL, watch, NULL);
      if (!monitor->inhibited)
        {
          g_source_set_ready_time (source,
                                   monitor->last_event_time +
                                   timeout_msec * 1000);
        }
      g_source_attach (source, NULL);
      g_source_unref (source);

      watch->timeout_source = source;
    }

  g_hash_table_insert (monitor->watches,
                       GUINT_TO_POINTER (watch->id),
                       watch);
  return watch;
}
make_watch() 函数会由两种不同的 watch 生成函数调用:meta_idle_monitor_add_idle_watch() 和 meta_idle_monitor_add_user_active_watch()。
在 mutter 中,”idle watch” 是一个积累 idle time 的定时器,在到达指定的时间之后会执行回调函数;而 “user active watch” 是一个一次性的定时器,当用户活跃时就会执行回调,并且销毁自己。上面只有 idle watch 调用 make_watch() 的时候 timeout_msec 不为 0,所以之后只关心它。
而 meta_idle_monitor_remove_watch() 则可以销毁 watch。
这些函数在 meta-idle-manager.c 里面似乎又包了一层,handle_add_idle_watch() 和 handle_remove_watch() 分别和对应的信号绑定。
看起来,只要外面正确调用了 add idle watch 和 remove watch,就不会有问题。
是 gnome-shell 或者扩展的问题吗?
在 gnome-shell 代码里面搜索:
> rg add_idle_watch
js/ui/pointerWatcher.js
39:        this._idleMonitor.add_idle_watch(IDLE_TIME, this._onIdleMonitorBecameIdle.bind(this));

js/ui/unlockDialog.js
344:        this._idleWatchId = this._idleMonitor.add_idle_watch(HINT_TIMEOUT * 1000, () => {
600:        this._idleWatchId = this._idleMonitor.add_idle_watch(IDLE_TIMEOUT * 1000, this._escape.bind(this));
其中 pointerWatcher 只会在放大镜功能里用到,而 unlockDialog 看起来销毁逻辑也是正确的。对于我用的扩展,Dash to Dock 会使用 pointerWatcher,所以是它的问题吗?
我尝试自己编译了一份 mutter,在每次 add idle watch 和 remove watch 的时候打印一下,结果发现:
- 打开 Lollypop(一个音乐播放器)的时候,会有 idle watch 添加和销毁,但是好像有些 idle watch 总是不会被销毁;
- 打开 Steam 之后,idle watch 的相关行为变得更加频繁;
- 以上的事件看起来和扩展无关:因为即使全部关闭也是如此。
DBus…??
此时我注意到,meta-idle-manager.c 里面有一些和 DBus 有关的操作,于是用 dbus-monitor 看一下有没有可疑的消息:
dbus-monitor --session | grep -i idle
结果发现,在 mutter 有调试输出的时候,dbus-monitor 也有反应,证明这些 idle watch 都是通过 DBus 通信创建/销毁的。busctl --user 可以看到发起的进程来源,结果竟然是……
gsd-power 和 gnome-session-binary。
(在 gdb 里面,可以 print ((DBusWatch *)((MetaIdleMonitorWatch *)((GSourceCallback *)((GSource*){i})->callback_data)->data)->user_data)->dbus_name 来看对应的 source)
所以是它们的实现问题?不过在此之前,先来验证一下 DBus 创建的 idle watch 的行为。我拿 zbus 整了个 demo:
use std::{time::Duration, thread::sleep};

use zbus::blocking::Connection;

mod mutter;

fn main() {
    let connection = Connection::session().unwrap();
    let proxy = mutter::IdleMonitorProxyBlocking::new(&connection).unwrap();
    for _ in 0..10000 {
        let res = proxy.add_idle_watch(110000 * 1000);
        // println!("{:?}", res);
    }
    loop {
        sleep(Duration::from_secs(10));
    }
}
mutter 的 mod 由 zbus-xmlgen --session org.gnome.Mutter.IdleMonitor /org/gnome/Mutter/IdleMonitor/Core 生成,并且需要加上 default_path = "/org/gnome/Mutter/IdleMonitor/Core"。
运行之后可以发现:
- 我们成功搞出了 10000 个 idle watch
- GNOME 确实变卡了,如果开个 3D 游戏会更明显
- 如果关掉进程,这些 idle watch 会一起销毁掉
所以,问题就在于 gsd-power 和 gnome-session-binary 长时间运行泄漏了大量的 idle watch 导致卡顿……但是这就是问题的根源了吗?
“gnome-desktop” 不是 “GNOME Desktop”
我检查的两者的代码,发现它们的 pattern 都是:add idle watch 之前,先销毁掉之前记录的 watch。而对应的函数是 gnome_idle_monitor_add_idle_watch(),这个函数并不在 gnome-settings-daemon 或者 gnome-session 里面,而是在 gnome-desktop 里面。
这个名字极其容易导致误解,以至于它的 README 里面这么写:
Bugs should be reported to the Issues section of gnome-desktop repository. Due to very high numbers of misdirected gnome-shell bugs, the issue tracker has unfortunately been restricted to GNOME developers only. If you have found a bug in this library, feel free to contact any GNOME developer and ask for your report to be forwarded here.
gnome-desktop 事实上做的事情是:为一些程序提供来自 gnome-shell 的接口。就我们的例子来说,DBus 请求其实是 gnome-desktop 帮它们干的。其中添加 idle watch 会调用:
static void
add_idle_watch (GnomeIdleMonitor      *monitor,
		GnomeIdleMonitorWatch *watch)
{
	meta_dbus_idle_monitor_call_add_idle_watch (monitor->priv->proxy,
						    watch->timeout_msec,
						    monitor->priv->cancellable,
						    on_watch_added, idle_monitor_watch_ref (watch));
}
on_watch_added 是一个执行之后的回调函数:
static void
on_watch_added (GObject      *object,
		GAsyncResult *result,
		gpointer      user_data)
{
	GnomeIdleMonitorWatch *watch = user_data;
	GnomeIdleMonitor *monitor;
	GError *error;
	GVariant *res;

	error = NULL;
	res = g_dbus_proxy_call_finish (G_DBUS_PROXY (object), result, &error);
	if (!res) {
		if (g_error_matches (error, G_IO_ERROR, G_IO_ERROR_CANCELLED)) {
			g_error_free (error);
			idle_monitor_watch_unref (watch);
			return;
		}

		g_warning ("Failed to acquire idle monitor proxy: %s", error->message);
		g_error_free (error);
		idle_monitor_watch_unref (watch);
		return;
	}

	if (watch->dead) {
		idle_monitor_watch_unref (watch);
		return;
	}

	monitor = watch->monitor;
	g_variant_get (res, "(u)", &watch->upstream_id);
	g_variant_unref (res);

	g_hash_table_insert (monitor->priv->watches_by_upstream_id,
			     GINT_TO_POINTER (watch->upstream_id), watch);
	idle_monitor_watch_unref (watch);
}
而删除 watch 的操作,在 gnome_idle_monitor_remove_watch() 里面:
void
gnome_idle_monitor_remove_watch (GnomeIdleMonitor *monitor,
				 guint		   id)
{
	GnomeIdleMonitorWatch *watch;

	g_return_if_fail (GNOME_IS_IDLE_MONITOR (monitor));

	watch = g_hash_table_lookup (monitor->priv->watches, GINT_TO_POINTER (id));
	if (!watch)
		return;

	if (watch->upstream_id)
		meta_dbus_idle_monitor_call_remove_watch (monitor->priv->proxy,
							  watch->upstream_id,
							  NULL, NULL, NULL);

	gnome_idle_monitor_remove_watch_internal (monitor, id);
}
可以看到,只有在 watch->upstream_id 有效的时候,才会实际发送删除 watch 的 DBus 请求。而这个参数的赋值在 on_watch_added 里面,如果 dbus 结果成功并且 watch->dead 为否,那么就会赋值。
而 watch->dead 会在销毁 watch 的时候被赋值:
static void
idle_monitor_watch_destroy (GnomeIdleMonitorWatch *watch)
{
	watch->dead = TRUE;
	idle_monitor_watch_unref (watch);
}
销毁操作在初始化的时候就注册在了 GHashTable 里面:
static void
gnome_idle_monitor_init (GnomeIdleMonitor *monitor)
{
	monitor->priv = gnome_idle_monitor_get_instance_private (monitor);

	monitor->priv->watches = g_hash_table_new_full (NULL,
							NULL,
							NULL,
							(GDestroyNotify)idle_monitor_watch_destroy);
	monitor->priv->watches_by_upstream_id = g_hash_table_new (NULL, NULL);

	monitor->priv->cancellable = g_cancellable_new ();
}
我尝试在 on_watch_added() 里面加了点 g_warning 来调试,结果发现有一些 watch 会触发 watch->dead 的分支,但是它们实际上是有 upstream_id 的!而 upstream_id 的信息在此之后就丢失了,所以 gnome-desktop 之后就无法向 mutter 发送删除对应 watch 的请求了,于是就导致了泄漏。从我的理解看,这种情况会发生在:
- 某个程序添加了一个 idle watch。
- 但是很快就 remove 了这个 watch,这个时候因为 DBus 相对慢一些(大概吧),
on_watch_added()还没跑完,因此没有upstream_id,remove 请求不会被发送,但是idle_monitor_watch_destroy()会被调用,因此watch->dead会被赋值。 - 之后
on_watch_added()执行,此时就走到watch->dead的分支了,因为没有在这个分支销毁 watch,因此upstream_id也就丢失了。
修复也很简单,我提交了一个 MR,很快就合并进去了,对应的 43.2 版本已经修复了这个问题。从对 on_watch_added 的 git blame 来看,这个问题似乎……已经有 10 年的历史了?
补充说明
很上面的地方提到,在分析 coredump 的时候,我发现虽然 sources 里面东西很多,但是 source_lists 就几个元素:
>>> gforeach i in context->source_lists: print (((GSourceList *)$i)->head)->name
$1 = 0x7f2519f78871 "GCancellable"
$2 = 0x0
$3 = 0x7f2519e0cb6a "GUnixSignalSource: SIGTERM"
$4 = 0x56505c38edf0 "[mutter] Wayland events"
$5 = 0x565063b1e040 "[mutter] Clutter frame clock (0x56506442a030)"
$6 = 0x0
并且,glib 的 gmain.c 里面,没有直接从 sources 这个 GHashTable 里面遍历的代码。难道我搞错了什么?我在写这篇文章的时候重新看了一下 glib 的代码,结果发现了我之前的一个错误:source_lists 并非 GSource 的列表,而是 GSource 的列表的列表!
在 struct _GSource 的定义里:
struct _GSource
{
  /*< private >*/
  gpointer callback_data;
  GSourceCallbackFuncs *callback_funcs;

  const GSourceFuncs *source_funcs;
  guint ref_count;

  GMainContext *context;

  gint priority;
  guint flags;
  guint source_id;

  GSList *poll_fds;

  GSource *prev;
  GSource *next;

  char    *name;

  GSourcePrivate *priv;
};
可以看到 prev 和 next。这表明了,其实 GSource 本身也是链表的节点。拿我之前的 coredump 试一下:
>>> gforeach i in context->source_lists: print (((GSourceList *)$i)->head)
$42 = (GSource *) 0x56505c195c70
$43 = (GSource *) 0x565061f8a9a0
$44 = (GSource *) 0x56505bdcf050
$45 = (GSource *) 0x56505c2cbaa0
$46 = (GSource *) 0x5650680b1860
$47 = (GSource *) 0x56506a7cd4f0
>>> print *((GSource *) 0x565061f8a9a0)->next
$48 = {
  callback_data = 0x56506a6d86e0,
  callback_funcs = 0x7f2519e303e0 <g_source_callback_funcs>,
  source_funcs = 0x7f25184b8500 <g_datetime_source_funcs>,
  ref_count = 1,
  context = 0x56505bdc2ab0,
  priority = -100,
  flags = 1,
  source_id = 11911477,
  poll_fds = 0x56505e4d1a60 = {[0] = 0x565067a11364},
  prev = 0x565061f8a9a0,
  next = 0x565067ff5e80,
  name = 0x0,
  priv = 0x7f23fb79f990
}
>>> print *((GSource *) 0x565061f8a9a0)->next->next
$49 = {
  callback_data = 0x565066bf54e0,
  callback_funcs = 0x7f2519e303e0 <g_source_callback_funcs>,
  source_funcs = 0x7f25184b8500 <g_datetime_source_funcs>,
  ref_count = 1,
  context = 0x56505bdc2ab0,
  priority = -100,
  flags = 1,
  source_id = 11911478,
  poll_fds = 0x565062786e80 = {[0] = 0x565067ff5ef4},
  prev = 0x565067a112f0,
  next = 0x56506574fe90,
  name = 0x0,
  priv = 0x56506a679950
}
>>> print *((GSource *) 0x565061f8a9a0)->next->next->next
$50 = {
  callback_data = 0x565062e67150,
  callback_funcs = 0x7f2519e303e0 <g_source_callback_funcs>,
  source_funcs = 0x7f25184b8500 <g_datetime_source_funcs>,
  ref_count = 1,
  context = 0x56505bdc2ab0,
  priority = -100,
  flags = 1,
  source_id = 11911479,
  poll_fds = 0x565062762150 = {[0] = 0x56506574ff04},
  prev = 0x565067ff5e80,
  next = 0x56506803aed0,
  name = 0x0,
  priv = 0x7f23aa743b50
}
所以其实当前处理的 source 远不止 6 个。我们的 idle source 也在里面:
>>> print *((GSource *) 0x56505bdcf050)->next->next->next->next->next->next->next->next->next->next->next->next->next->next->next->next->next->next->next->next->next->next->next->next->next->next->next->next->next->next->next->next->next->next->next->next->next->next->next->next->next->next->next->next->next->next->next->next->next->next->next->next->next->next->next->next->next->next->next->next->next->next->next->next->next->next->next->next->next->next->next->next->next->next->next->next->next->next->next->next->next->next->next->next->next->next->next->next->next->next->next->next->next->next->next->next->next->next->next->next->next->next->next->next->next->next->next->next->next->next->next->next
$77 = {
  callback_data = 0x56505f338bd0,
  callback_funcs = 0x7f2519e303e0 <g_source_callback_funcs>,
  source_funcs = 0x7f251908f120 <idle_monitor_source_funcs>,
  ref_count = 1,
  context = 0x56505bdc2ab0,
  priority = 0,
  flags = 1,
  source_id = 274802,
  poll_fds = 0x0,
  prev = 0x565062083920,
  next = 0x56505d6fb170,
  name = 0x565060556180 "[mutter] Idle monitor",
  priv = 0x56505c85e890
}
总结
其实还挺开心的,虽然我还是不知道 perf 那个输出是怎么回事。同时,我也希望这篇文章能帮助读者调试类似的性能问题:有关 gnome-shell 性能调试的技巧网络上很少,我也试过 sysprof,对于这个例子没有给出有价值的信息(可能是漏了啥,比如说 fno-omit-frame-pointer 之类,虽然没有查过,但是猜测 Arch 没开这个 flag)。同时使用 gcore 也对调试起到了相当大的帮助(因为显然不能直接 gdb attach 上去,否则整个图形界面就卡住了)。
感觉如果之后再有有趣的调试经历的话,「调试一则」或许可以弄成一个系列也说不准。
Comments